Seasonal Wardrobe Wear
Average Wears per Calendar Month
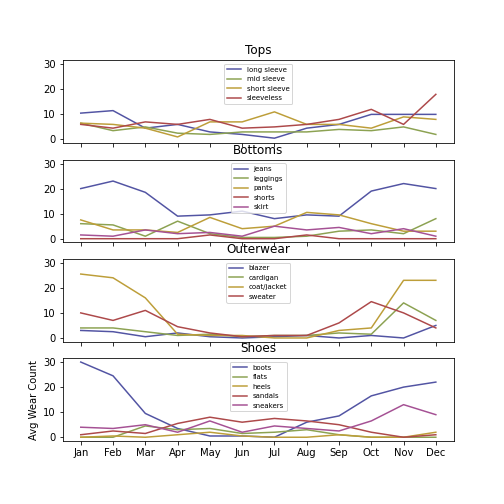
I was curious whether or not the calendar month influenced the categories that I most frequently wore. To create these line graphs, I calculated the total number of wears per category for each complete month in the dataset (1/2019-10/2020). I then calculated the average total wears for each calendar month.
There is an expected increase in my use of outerwear (and boots) during the colder months. Interestingly, my preference for tops does not seem to be greatly influenced by season. This may be due to the fact that I usually wear multiple layers in the winter and my base layer is not necessarily influenced by the weather.
Visualizations